SBOC Mapping Session #1 2024
The basics
Maps must follow British Orienteering rules →
Map Specifications
- International Specification for Orienteering Maps (ISOM) (often referred to as sprint spec)
- International Specification for Sprint Orienteering Maps (ISSprOM) (often referred to as forest spec)
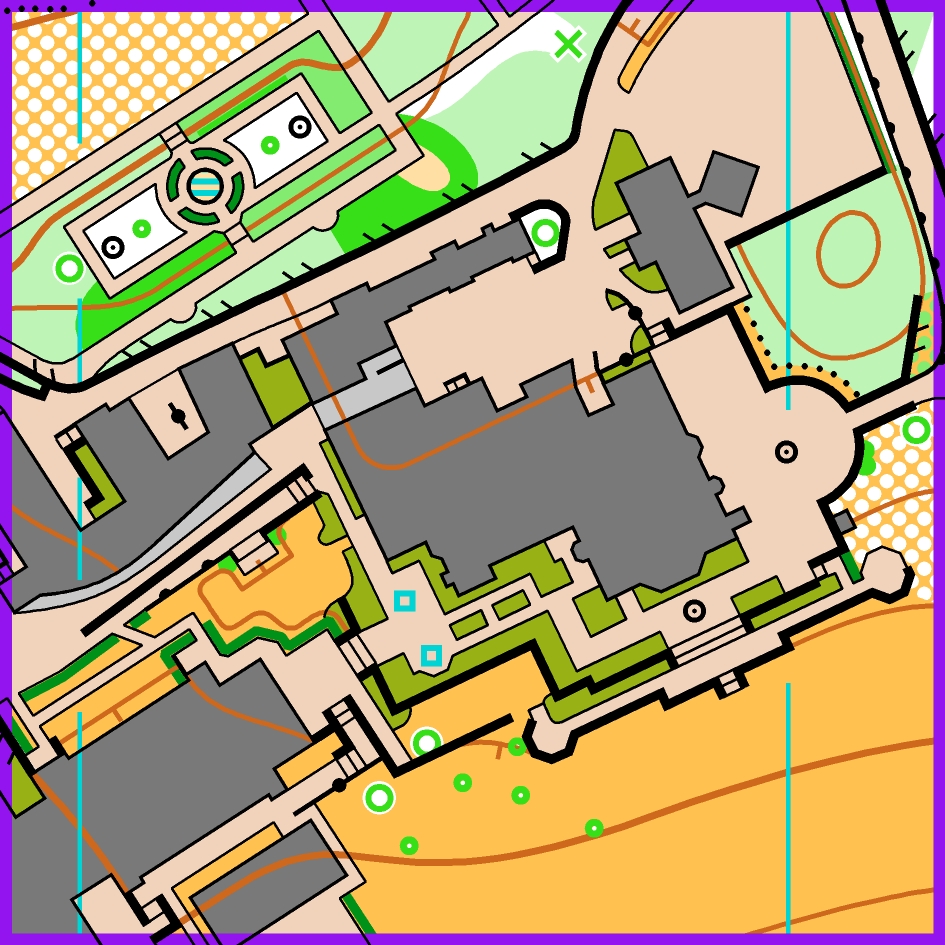
ISSprOM (Sprint) 160x160m
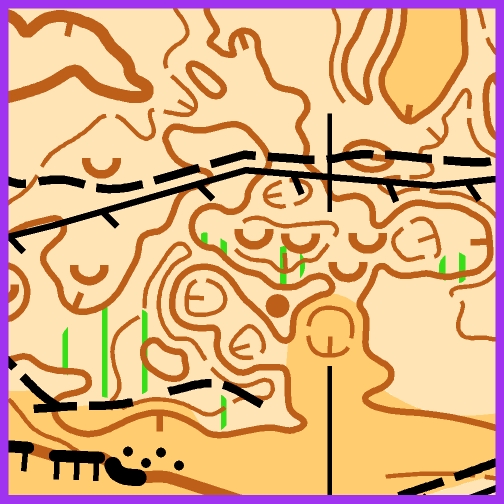
ISOM (Forest) 160x160m
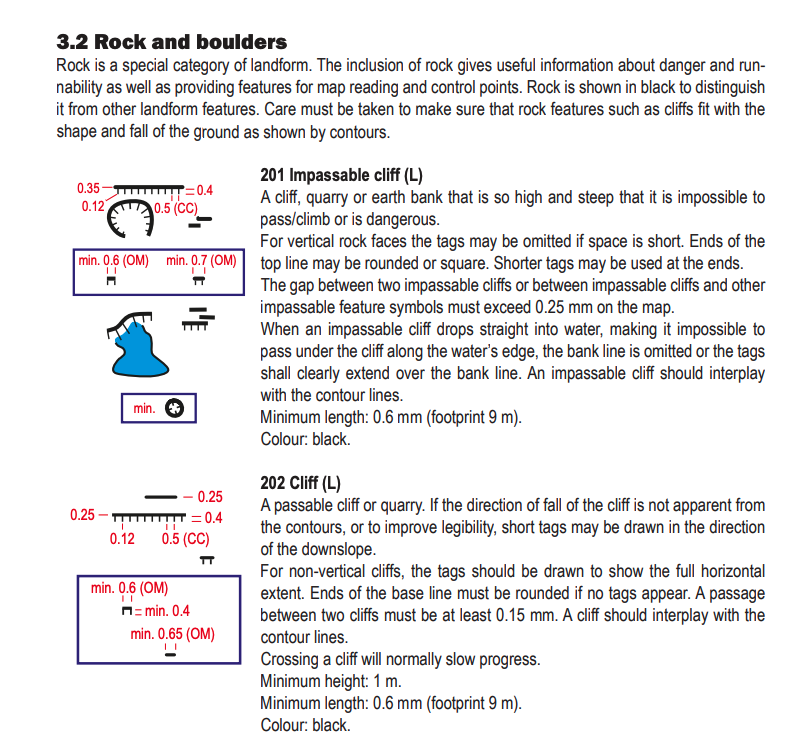
A typical page from the ISOM Specification:
Quiz - how well can you recognise the different specifications?
- Tunnel

ISSprOM / ISOM

ISSprOM / ISOM
- Ruins

ISSprOM / ISOM

ISSprOM / ISOM
3. Footbridges

ISSprOM / ISOM

ISSprOM / ISOM
4. Uncrossable / Impassable Walls

ISSprOM / ISOM

ISSprOM / ISOM
Geo-referencing
Geo-referencing is the process of aligning a map with real-world geographic coordinates. This makes it more accurate and easier to update because basemaps, such as OS maps, can be accurately loaded into the correct place.
Geo-referenced maps also allow for gps to be used so tools like RouteGadget become more useful.
Basemaps
The more effort you put into preparing the basemap, the more accurate your final map will be, and the less time you'll spend surveying.
Some examples of different basemap material:
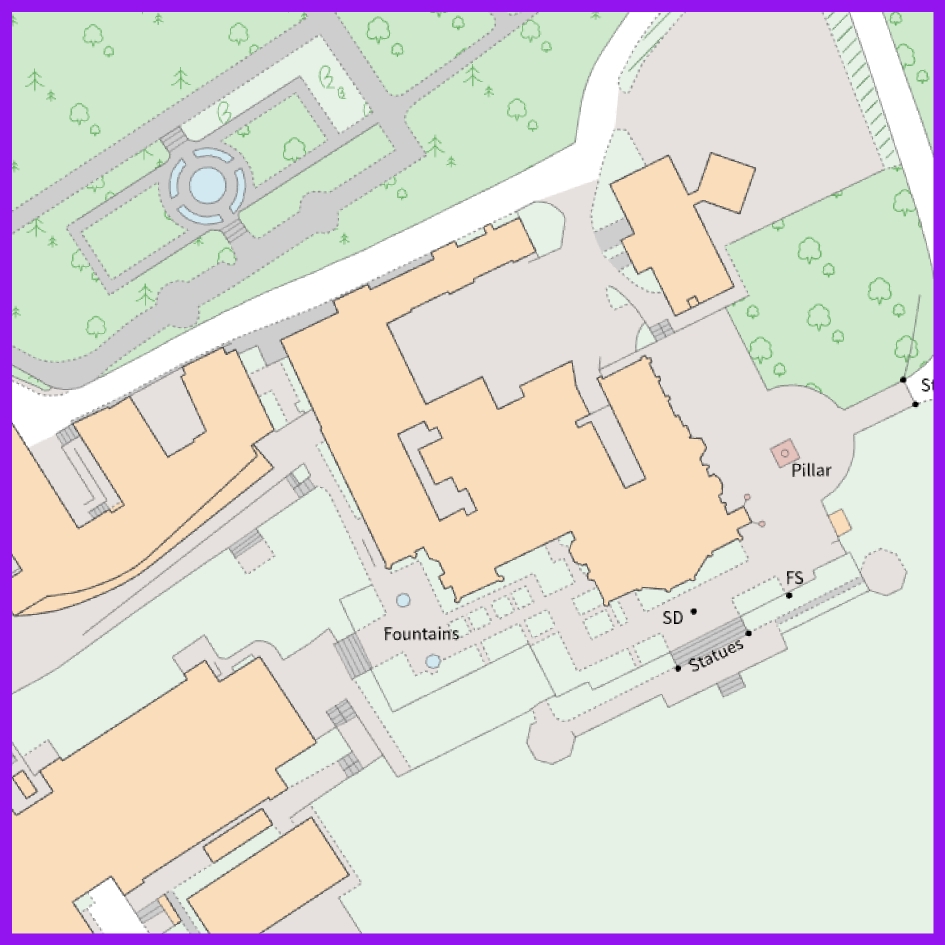
Ordnance Survey
- OS Mastermap 1:1250
- OS Leisure / Explorer 1:25000


OS Mastermap data is available through the OS data hub
If you create an account you can download £1000 free per month - 15 tiles of OS Mastermap is about 3p
OS 1:25000 isn’t particularly useful - but better than nothing
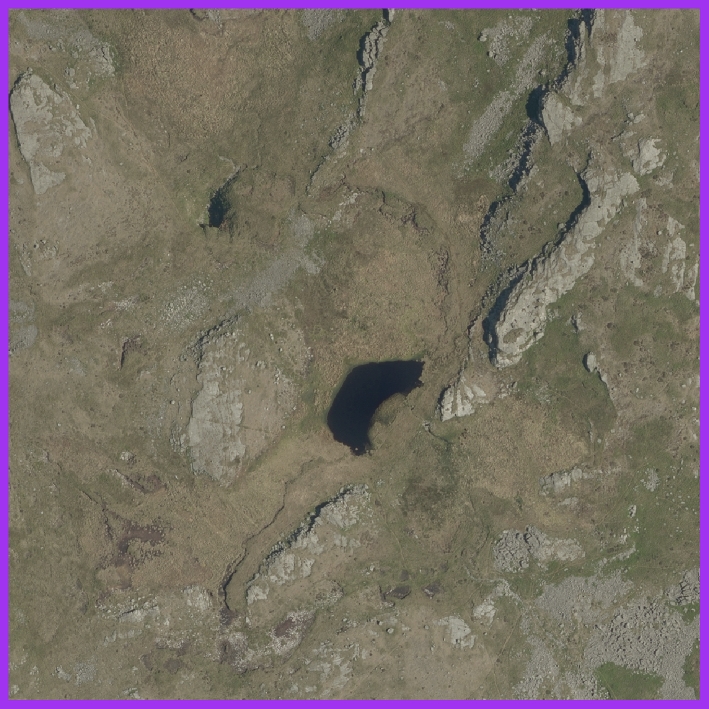
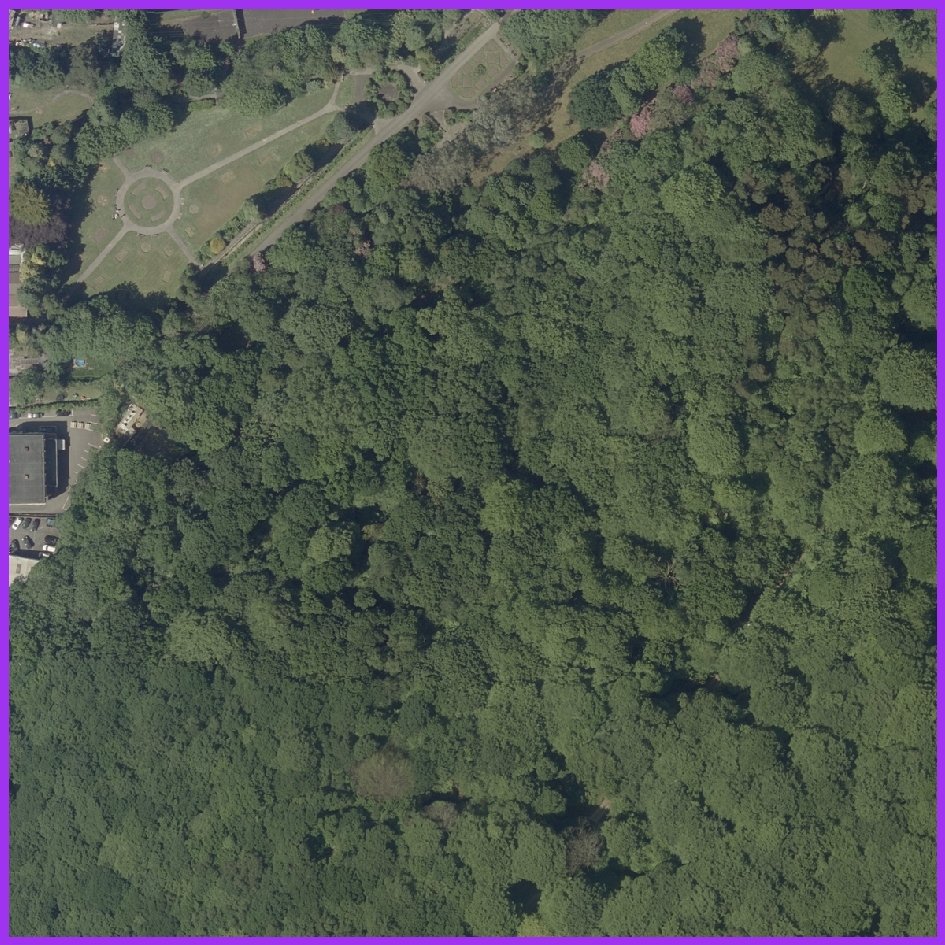
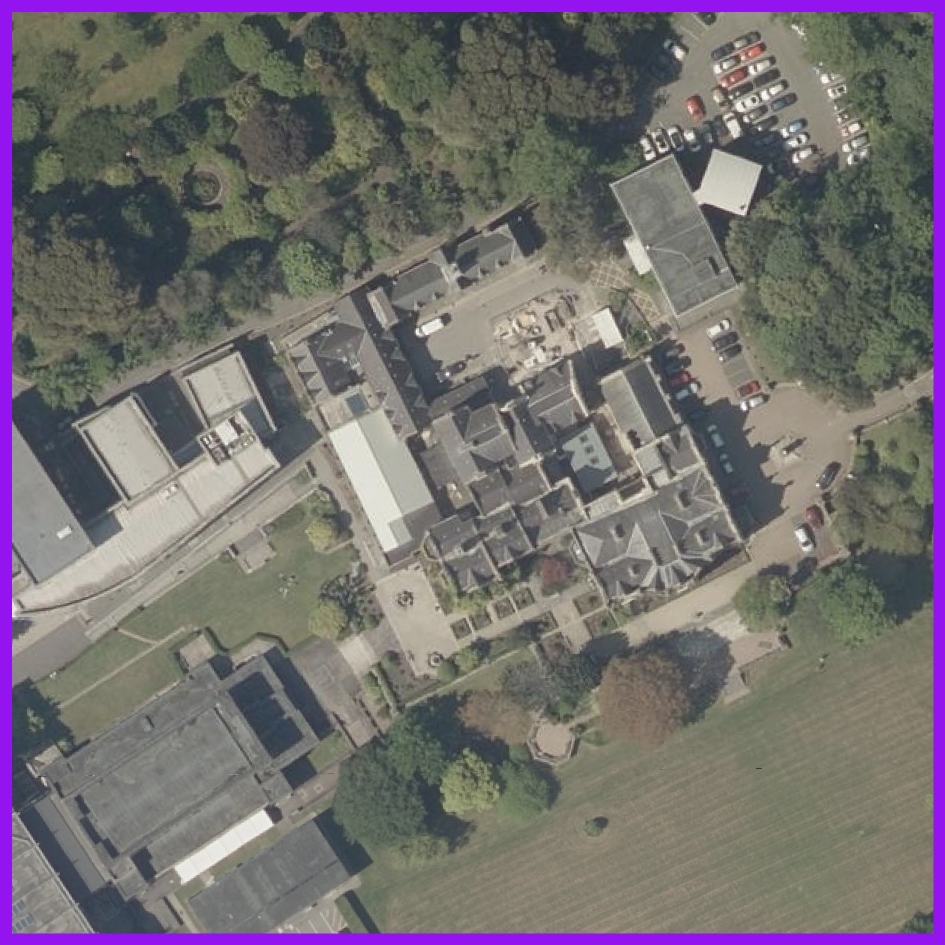
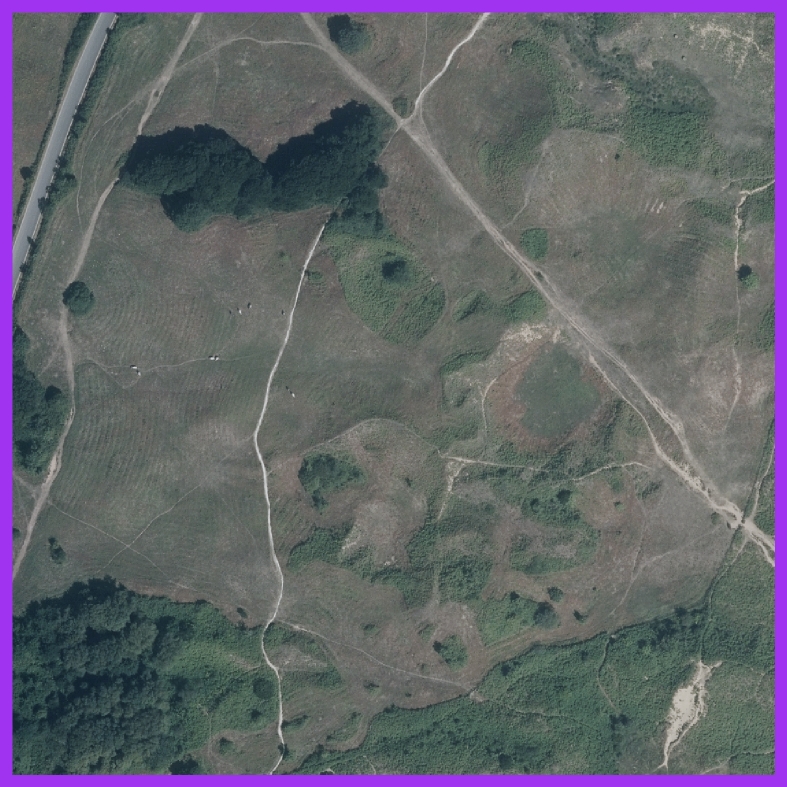
Aerial Imagery
Google Maps or Commercial Imagery (which up to 12.5cm resolution)
Great for open areas, not so great for forested areas.

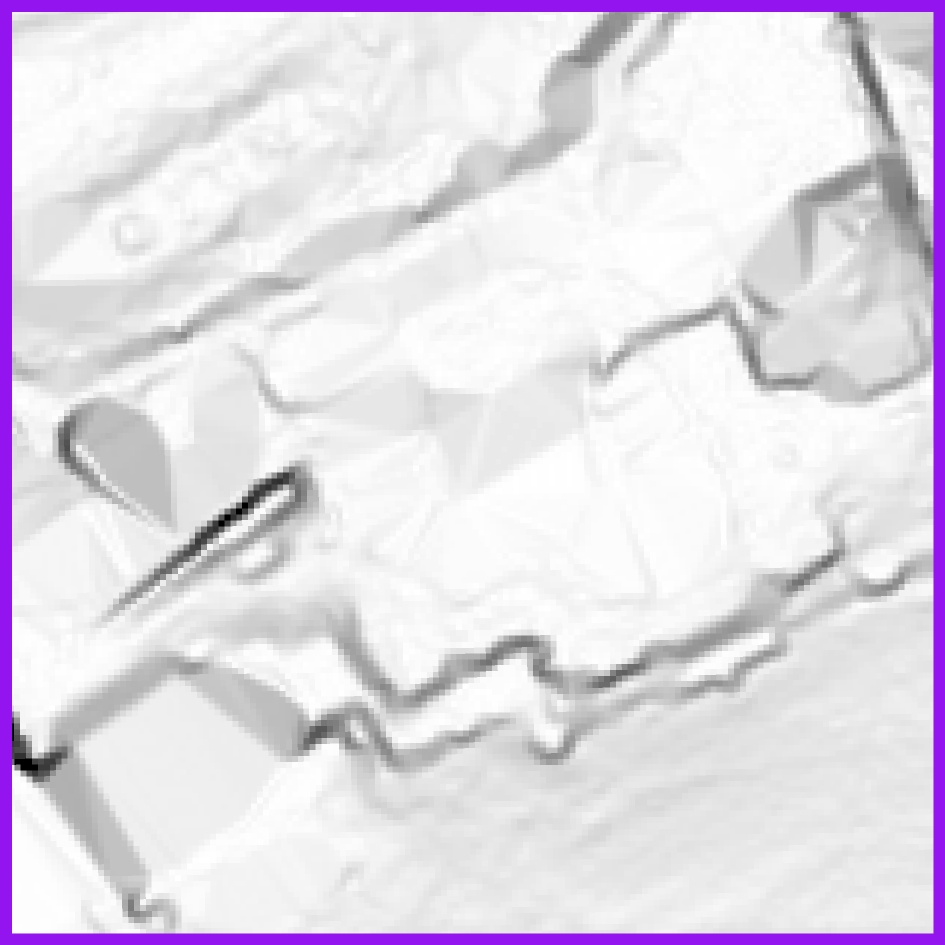
LiDAR
Welsh Lidar - https://datamap.gov.wales/maps/lidar-viewer/
LiDAR is freely available in Wales - the whole country was surveyed in 2021-2022 at 1m resolution.
The data you can download has been processed and classified into DTM and DSM forms.
DTM = Digital Terrain Model = represents the elevation of the ground
DSM = Digital Surface Model = represents the elevation of the tallest surfaces at that point
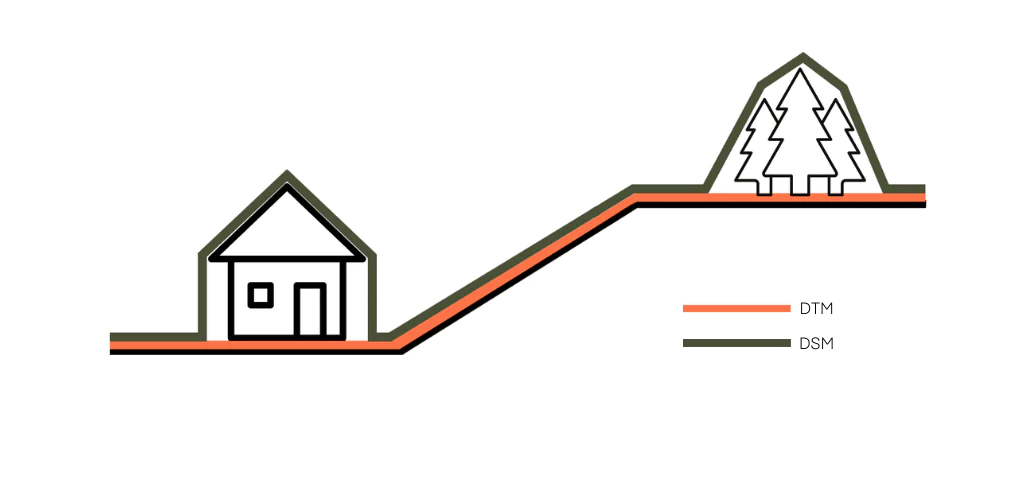


Notice the differences between the two models.
You can process LiDAR in different ways to emphasise different features of the terrain:
Below are some examples of basemaps you can derive from the data using OCAD’s Digital Elevation Model (DEM) Wizard.
The examples shown are of Oxwich Burrows.
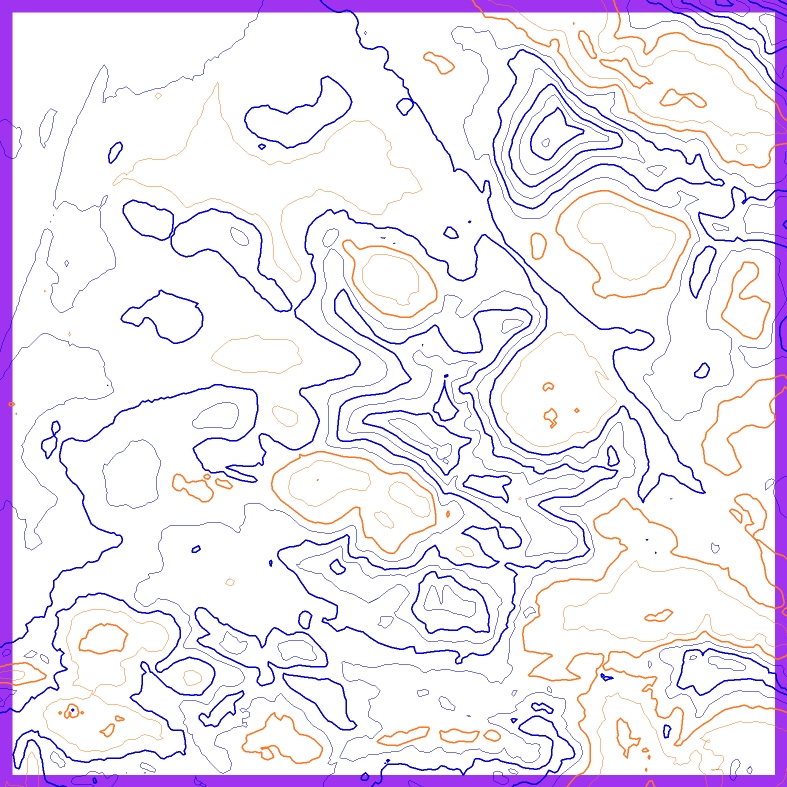
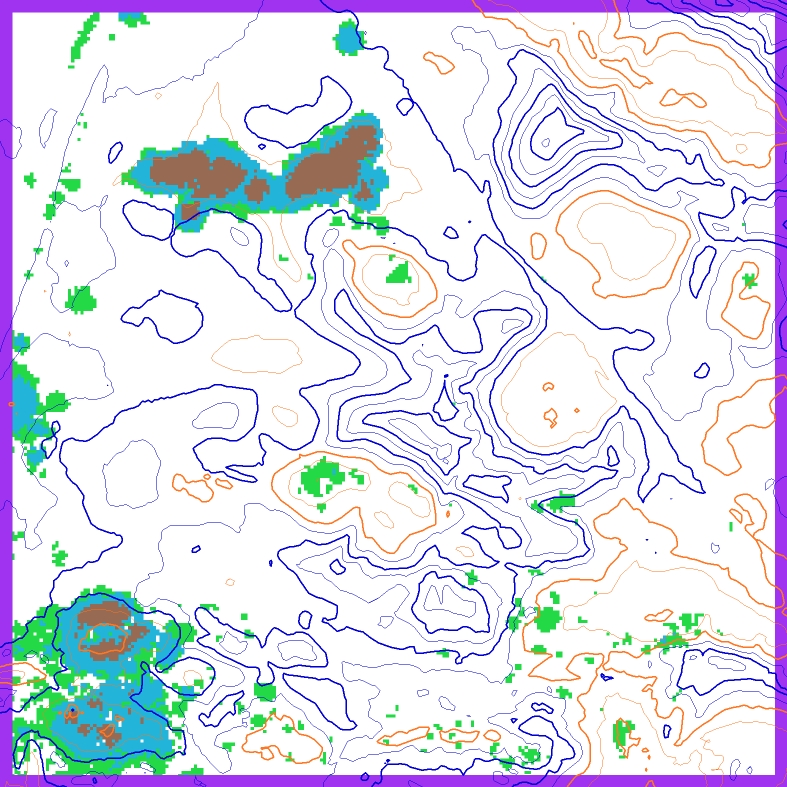
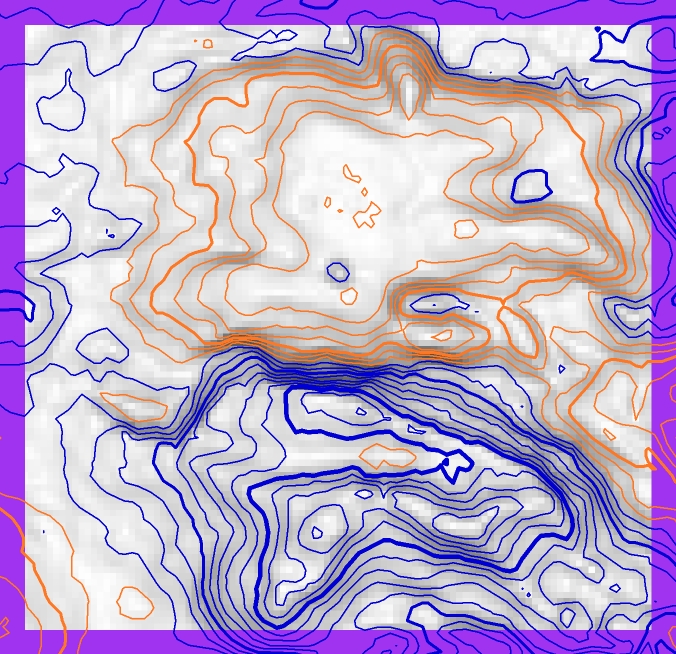
Generate Contours
Contours can be generated at any interval you set - my recommendation is 1m for forest maps and 0.5m for sprint. The smaller the interval the larger the file! OCAD can recognise negative contours too.
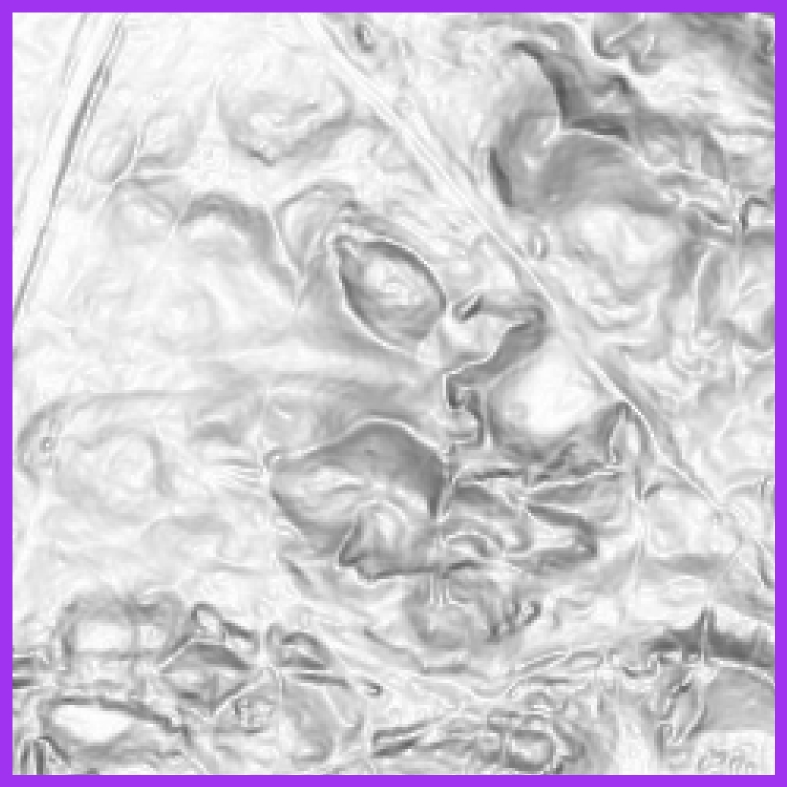
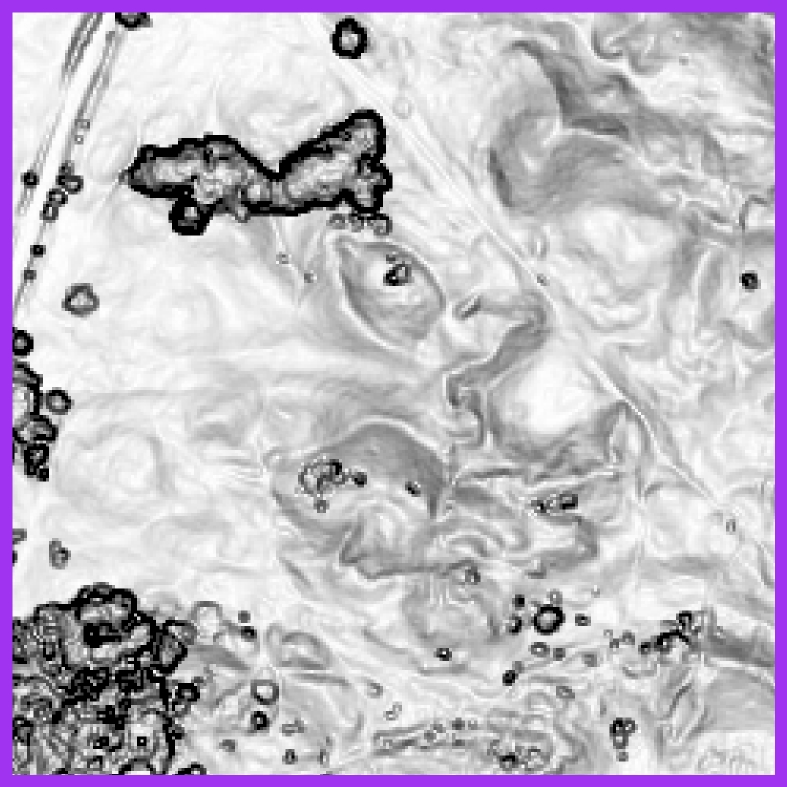
Slope Gradient Map
The steeper the angle of slope the darker the image - this is useful for mapping crags and shifting contours to show more prominent shapes
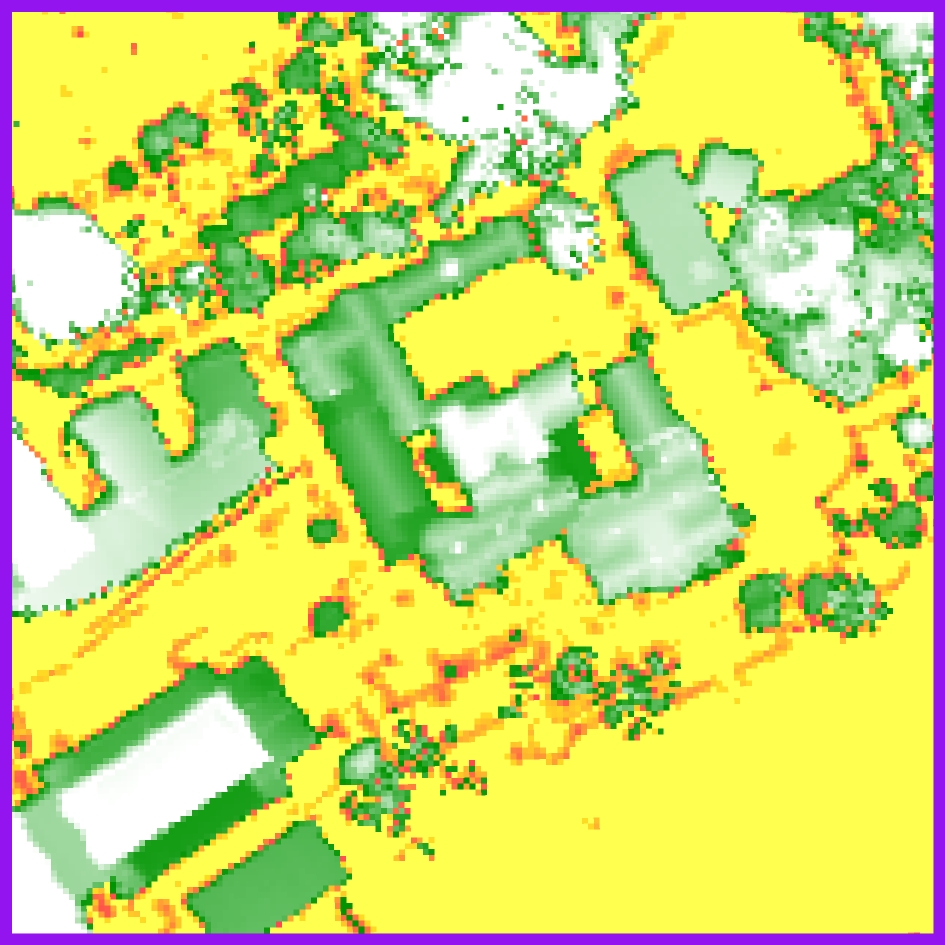
Vegetation Height Map
Vegetation Height map = Looks at the difference between the DTM and the DSM and provides a basemap with colors that represent the height - this is useful for plotting vegetation boundaries or distinct trees. OCAD provides different default colour templates for different heights. You can customise to get different viewpoints.
Welsh data is not yet provided in raw form which would allow further vegetation analysis, for example showing different vegetation levels underneath the canopy

So LiDAR improves the quality and accuracy of orienteering maps but only if used correctly as a base material.
It’s easy to fall into a trap of over-mapping with all the detail it provides.
Contours still need to be carefully adjusted to highlight prominent features that are easily visible to the eye.
From the specification:
“Absolute height accuracy is of little significance on an orienteering map. On the other hand, it is important that the map shows as correctly as possible the relative height difference between neighbouring features. Accurate representation of shape is of great importance for the orienteer, because a correct, detailed and sometimes exaggerated picture of the landform is an essential precondition for map reading.”
“Readability is always more important than absolute accuracy.”
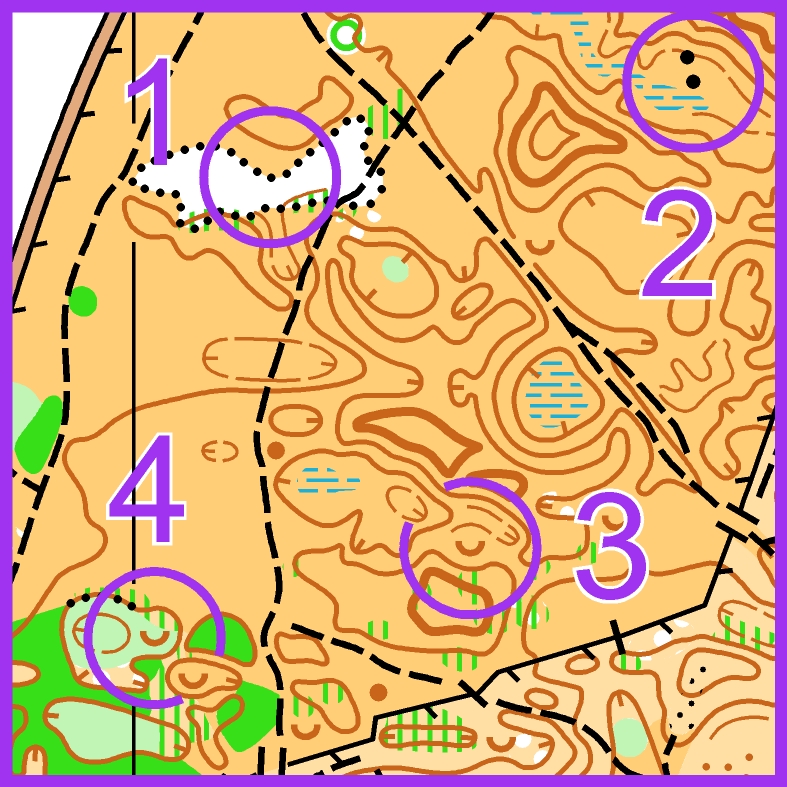
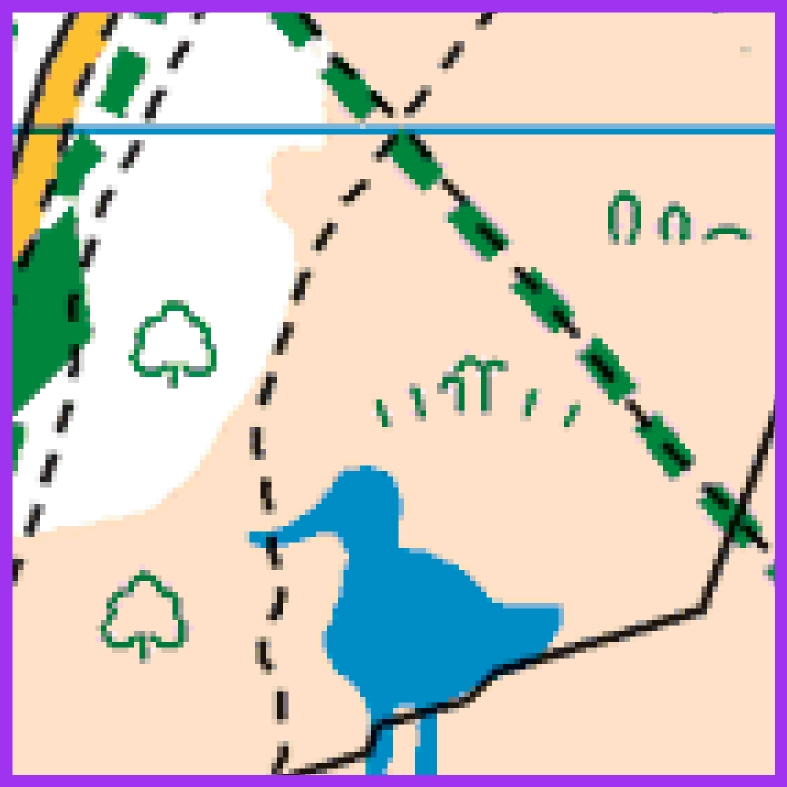
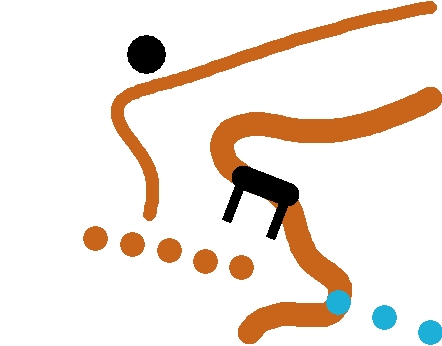
Quiz - Plot the controls onto the different basemaps
This will help show you the usefulness of each type in two different scenarios
- Singleton Park
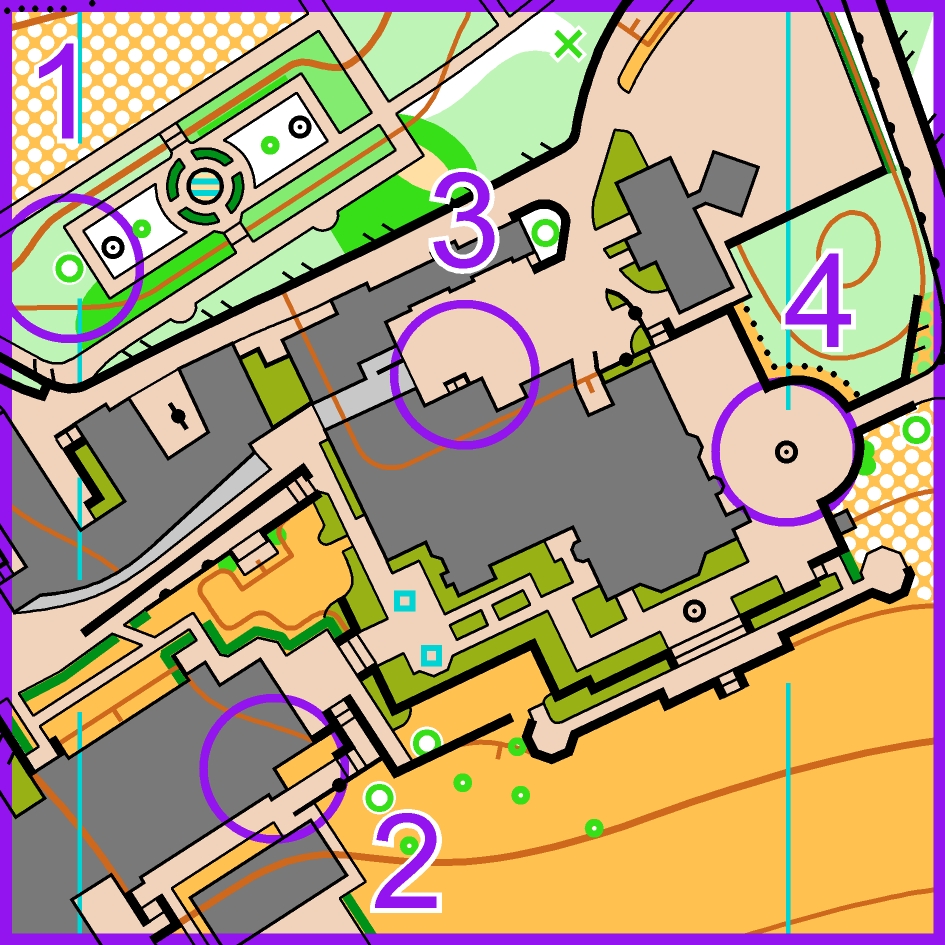
- Oxwich Burrows

A summary of the pros and cons for each basemap
Basemap | Pros | Cons |
OS | • Mostly reliable, and widely used
• Useful for sprint mapping, building plans, and street level data | • Limited detail in remote or wooded areas |
Aerial | • High resolution for visible features
• Provides accurate land cover information | • Limited use in woodland areas
• May have seasonal variations e.g Bracken! |
LiDAR | • Highly accurate elevation information
• Penetrates most vegetation for detailed maps | • Not updated very regularly
• Requires software like OCAD to process, and some knowledge for optimal use
• Welsh Data is pre-processed so it is not so useful for mapping different levels of vegetation |
Surveying
Once you have got your OCAD basemap set up and loaded onto OCAD Sketch (more detail on this process next week)
You need to walk around the area and use your observation to draw the map.
Look at carefully and focus on drawing the features that are important for navigation.
Draw symbols as they would appear on the map - the aim is you should be able to orienteer on your notes once you have finished.
The notes you have made can then be imported back into OCAD for drawing neatly at home.
The basemaps will help you accurately place features.
Map drawing exercise
1. Copy whilst looking
2. Look for 20s and then turn over and draw on the back
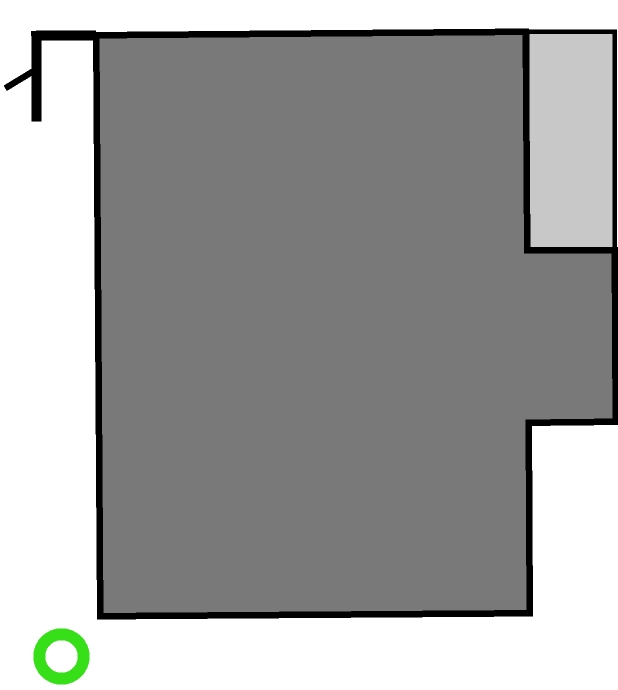
3. Re-draw some survey notes on the bottom image.
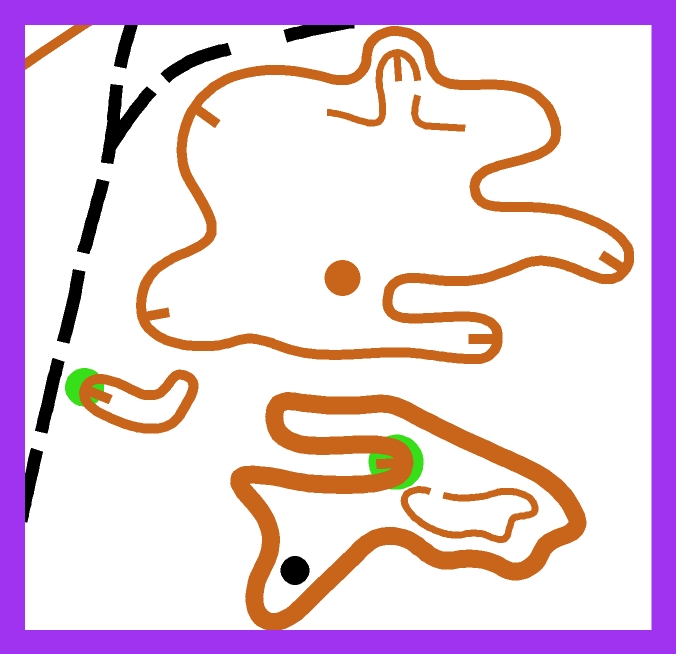
4. Difficult - 20s and then turn over and draw